
If the only metric you have is ‘hours saved’, you’ll end up in an argument about whether the hours were real. The better question is: what improved in the business – and can we see it in the workflow?
Most AI projects don’t fail because the model is bad. They fail because nobody can prove the win.
And when you can’t prove the win, the pilot quietly stalls: no budget, no owners, no scale.
So, let’s talk about measurement in a way that mid‑market operators can actually use.
First: stop trying to measure everything
You don’t need a perfect dashboard. You need a small scorecard that answers three executive questions:
- Is this reducing risk or rework?
- Is this increasing throughput or cycle speed?
- Is this improving quality and consistency?
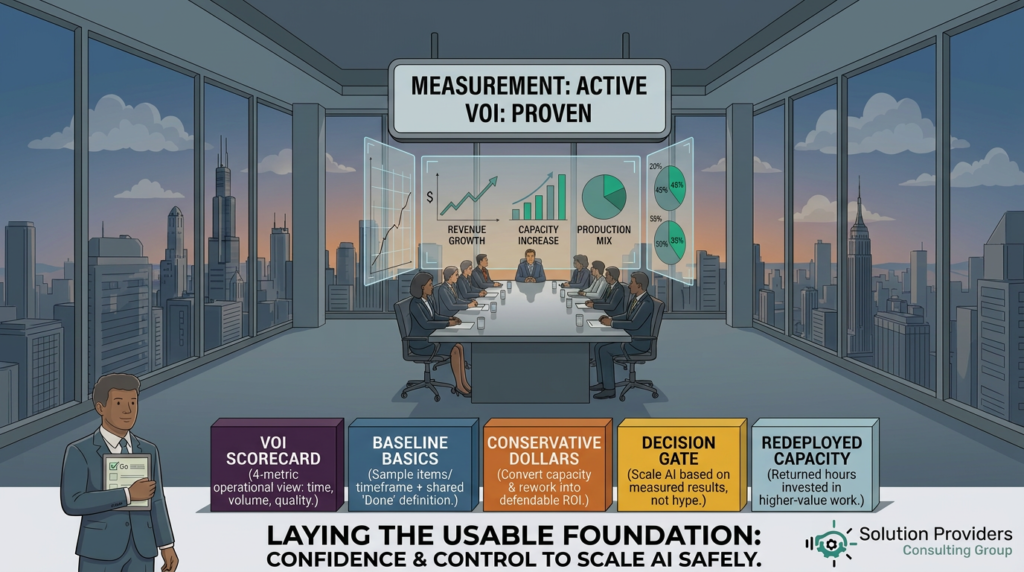
Use the ‘4 metrics’ VOI scorecard
Here’s a simple scorecard that works across most AI‑assisted workflows:
- Cycle time. How long does the task take end‑to‑end?
- Throughput. How many of these do we complete per week/month?
- Rework rate. How often do we have to fix it (internal or customer‑reported)?
- Error/incident rate. How often does it create a real problem (wrong info, wrong config, compliance issue)?
Notice what’s missing: ‘hours saved.’ Hours saved are not wrong – it’s just fragile. Use it as a supporting metric, not the headline.
Baseline in 30 minutes (seriously)
You only need two things to baseline:
- A small sample (last 10 – 20 items, or last 2 – 4 weeks)
- A consistent definition of ‘done’ (so you’re comparing apples to apples)
Then capture the baseline in plain language:
- Average cycle time: ___
- Volume per week: ___
- Rework examples (and frequency): ___
- Common errors/risks: ___
Translate metrics into dollars (without fantasy math)
CFOs don’t hate AI. They hate vague math.
So, use conservative conversions:
- Cycle time reduction × volume = capacity unlocked (not headcount reduction – capacity)
- Rework reduction = fewer escalations, less customer churn risk, fewer write‑offs
- Error reduction = fewer incidents and less downstream cost (and fewer uncomfortable calls)
If you do convert to dollars, be explicit about assumptions. Example:
“If we reduce cycle time by 10 minutes on a task we do 300 times per month, that’s 3,000 minutes—about 50 hours—of capacity returned. Using our blended internal value proxy (company revenue per employee converted to an hourly rate), that represents up to $5,000/month in redeployable capacity value—assuming we reinvest those hours into higher-value work.”
Decide what deserves to scale (a simple gate)
Here’s a practical scale gate we use:
- Measurable: we can see improvement in at least 2 of the 4 metrics
- Repeatable: results aren’t dependent on one ‘power user.’
- Defensible: data boundaries + review lane are clear
- Owned: someone is accountable for maintaining the workflow
A quick example (so this isn’t abstract)
Say you’re using AI to draft customer QBR narratives.
Your scorecard might look like:
- Cycle time: from 90 minutes → 45 minutes
- Throughput: from 6 per week → 10 per week
- Rework: fewer ‘rewrite’ requests from the account manager
- Errors: fewer incorrect inventory counts because you standardized the input data
That’s not ‘time saved.’ That’s faster cycle, higher volume, better quality – and it’s defendable.
If you measure in this way, you’ll know what to scale and what to stop.
Next post, we’ll shift from measurement to ‘enablement’: how to turn prompting into reusable playbooks – so results are consistent across the team (not just with one or two experts).